


Introducing the Polkadot Ecosystem Dashboard on The Tie Terminal
We are excited to unveil the Polkadot Ecosystem Dashboard, the latest preset dashboard to The Tie Terminal. With this integration, our institutional clients can access a comprehensive suite of analytics for Polkadot-based assets, enabling them to leverage The Tie Terminal to analyze activity across the Polkadot ecosystem and compare it with other leading ecosystems.
The Polkadot Ecosystem Dashboard offers a deep dive into essential metrics and insights, allowing users to understand key aspects of the network's performance and usage. By accessing Polkadot blockchain data via The Tie Terminal, investors and traders can gain valuable insights, make more informed decisions, and enhance their understanding of the assets and projects within the ecosystem. This new dashboard provides our extensive network of institutional clients with in-depth coverage of one of the most dynamic ecosystems in the digital asset space.
The dashboard features account specific and native token metrics, allowing users to track the growth of the ecosystem by monitoring new, active, and cumulative account metrics over time for each parachain, offering a clear view of user adoption and engagement. It also provides detailed data on the total, staked, and circulating supply units of parachain tokens, alongside information on the number of native token holders, reflecting the community's growth and interest. Additionally, users can analyze price trends for native tokens across the ecosystem.
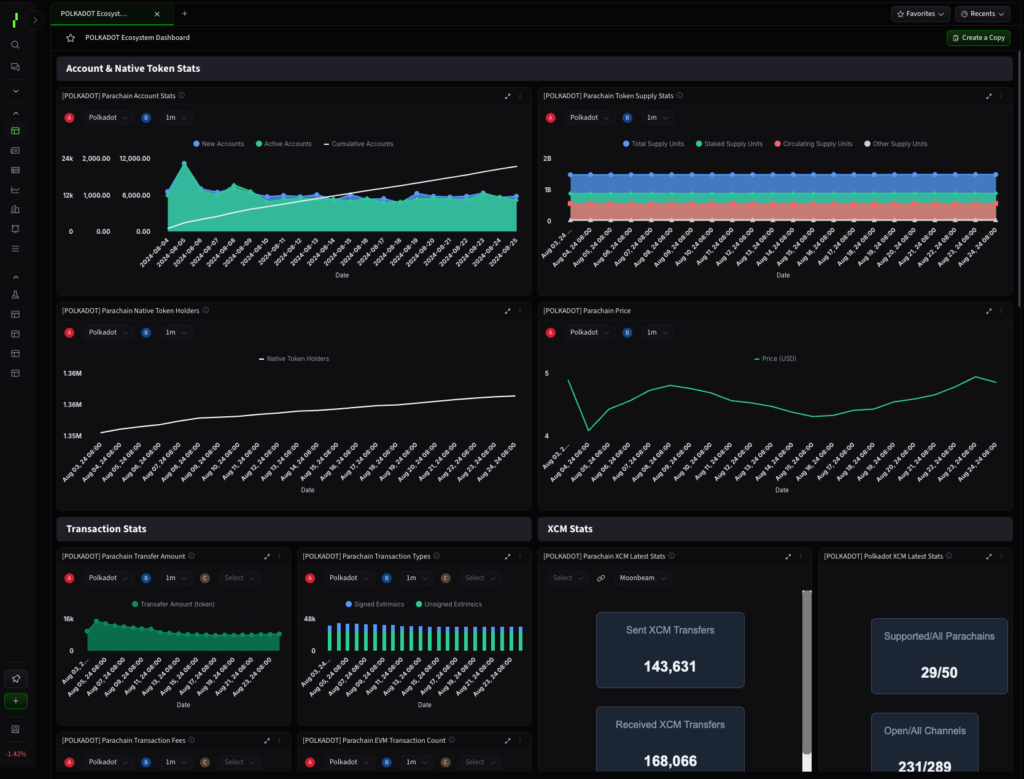
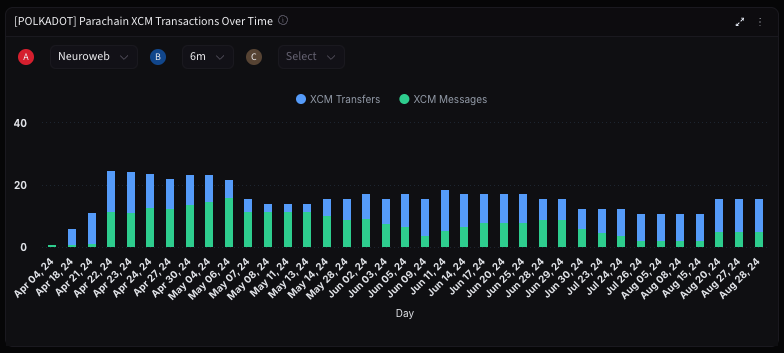
Get an overview of transaction metrics, providing visibility into the volume of native tokens transferred within parachains over time. The dashboard categorizes transactions into signed and unsigned types, giving insights into network activity and user behavior. Furthermore, users can track transaction fees in both native tokens and USD, assessing the cost-effectiveness of transactions, and view the transaction count for parachains with Ethereum Virtual Machine (EVM) compatibility, such as Moonbeam and Astar. The dashboard also tracks Cross-Consensus Messaging (XCM) transactions over time, facilitating an understanding of cross-chain interactions and interoperability within the Polkadot network.
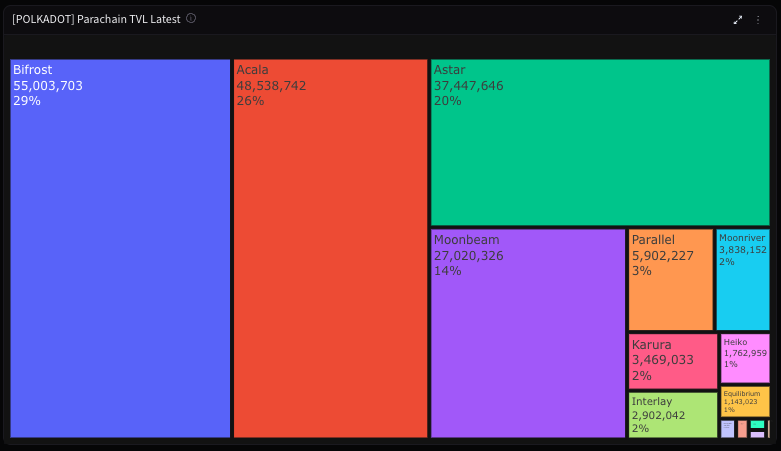
Total Value Locked (TVL) metrics offer a detailed analysis of the value locked across parachains, updated every 12 hours. This includes various categories such as staking, governance tokens, and liquid staking. A treemap component provides a visual representation of the latest TVL metrics, offering a high-level perspective of the ecosystem.
The dashboard displays the latest XCM metrics, including the number of XCM transfers, messages, open channels, and connected parachains. It also provides a comprehensive overview of Polkadot's XCM activity, showcasing the supported parachains and relayed messages.
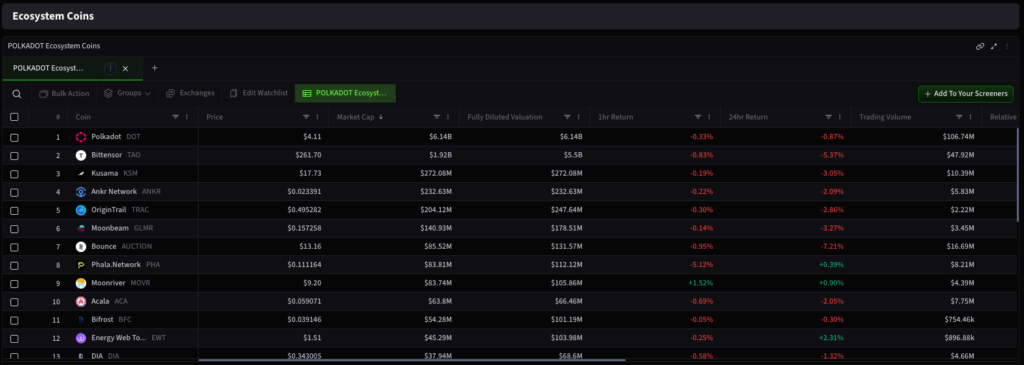
Lastly, users can use the screener to track ecosystem coins and events, enabling them to select specific coins, watchlists, or sectors to filter the dashboard according to their preferences. An ecosystem events component keeps users informed about key events within the Polkadot ecosystem, ensuring they stay updated on important developments.
The Polkadot Ecosystem Dashboard is designed to provide users with a holistic view of the network's performance, making it easier to track developments, analyze trends, and explore the diverse projects within the Polkadot ecosystem. With this addition, The Tie Terminal continues to be an essential tool for institutional clients seeking comprehensive and actionable data in the digital asset space.
"We're excited to launch the Polkadot Ecosystem Dashboard, providing our institutional clients with powerful tools to analyze and understand the rapidly evolving Polkadot ecosystem. This addition to The New Tie Terminal reflects our commitment to delivering the most comprehensive insights, enabling informed decision-making in institutional crypto."
Joshua Frank, Co-Founder & CEO, The Tie
You can find the Polkadot Ecosystem Dashboard under "Presets" in the Dashboard Selection screen.