Charting
Two Charts, Endless Possibilities
The Tie Terminal provides the most comprehensive charting capabilities through our unique Research and Trading Charts.
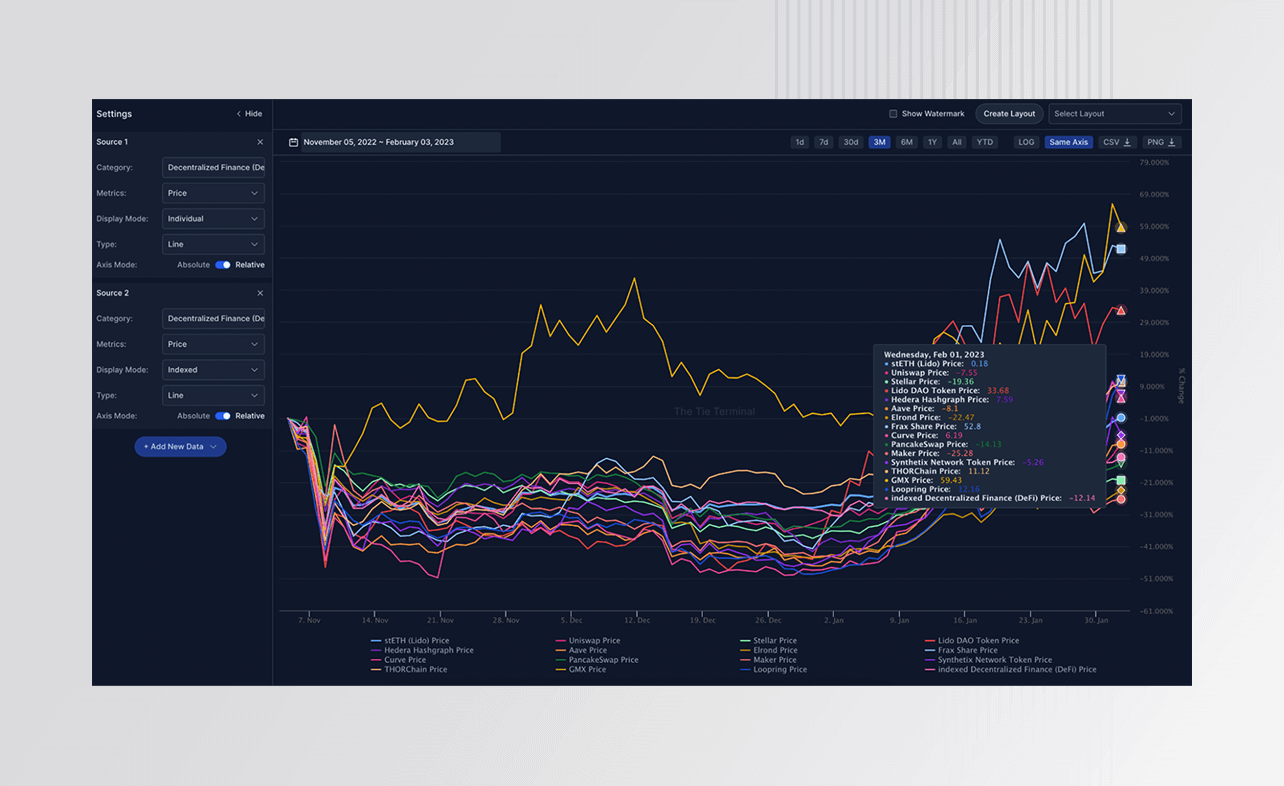
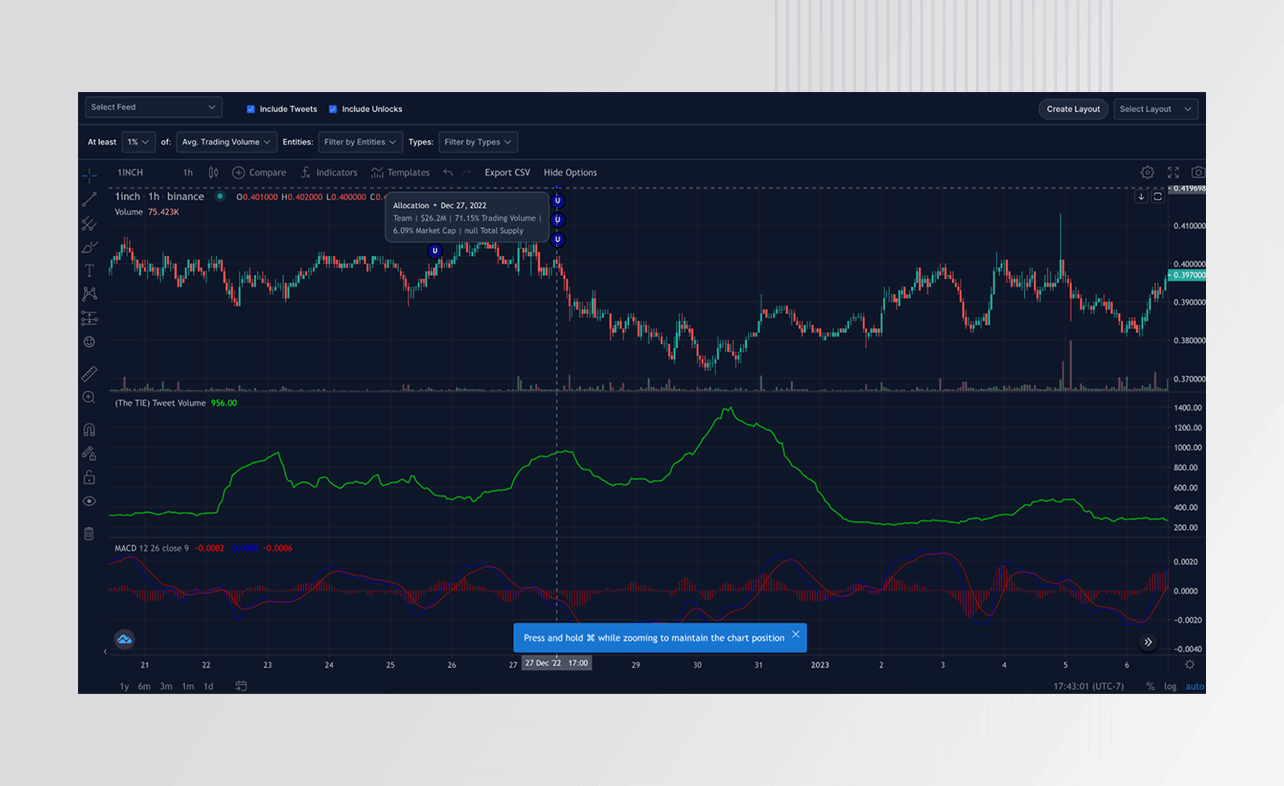
Our Research Chart is focused on indexing, benchmarking, and cross-asset comparisons, while the Trading Chart enables you to dive-deep into individual assets across hundreds of metrics to gain the clearest understanding of what's driving price movement.
Contact UsKey Benefits
The Tie Terminal Charting
Comprehensive Charting Capabilities
The Tie Terminal offers both Research and Trading Charts, providing a wide range of charting options for indexing, benchmarking, cross-asset comparisons, and in-depth analysis of individual assets and metrics.
The Tie Terminal offers both Research and Trading Charts, providing a wide range of charting options for indexing, benchmarking, cross-asset comparisons, and in-depth analysis of individual assets and metrics.
Customizable Indices & Benchmarking
Utilize The Tie's proprietary asset taxonomy to create sector, sub-sector, ecosystem, and native-chain indices, and leverage watchlists to create custom market-cap weighted asset baskets for powerful benchmarking and analysis.
Utilize The Tie's proprietary asset taxonomy to create sector, sub-sector, ecosystem, and native-chain indices, and leverage watchlists to create custom market-cap weighted asset baskets for powerful benchmarking and analysis.
Visualize Market Impact & Optimize Strategies
Overlay any metric, technical indicator, news, and historical unlocks on a single real-time chart to analyze market responses, optimize strategies, and gain a complete picture of the digital asset market for informed decision-making.
Overlay any metric, technical indicator, news, and historical unlocks on a single real-time chart to analyze market responses, optimize strategies, and gain a complete picture of the digital asset market for informed decision-making.
A Closer Look At
Charting
Powerful Benchmarking with Bespoke Indices

Powerful Benchmarking with Bespoke Indices
Index Any Metric
- The Tie offers sector, sub-sector, ecosystem, and native-chain classification for robust indices and comparisons.
Comprehensive Metrics
- Chart key on-chain, sentiment, risk, developer, derivative, and market data metrics across coins and sectors for in-depth research.
Customizable Experience
- Use watchlist functionality to create your own market-cap weighted asset baskets, save and share layouts for collaboration, and download data via CSV for further analysis.
One Chart for Every Metric

One Chart for Every Metric
Comprehensive Visualization
- Overlay any metric, technical indicators, news, and historical unlocks on a single, real-time trading chart.
Informed Decision-Making
- Analyze market responses to historical unlocks, news stories, and major events to optimize trading, campaigns, and announcements.
All-in-One View
- Gain a complete picture of the digital asset market by combining on-chain, off-chain, technical indicators, news, and events on one screen.
Talk to a Solutions Expert
Connect with our team to see how The Tie Terminal keeps you on top of the crypto market.

The New Tie Terminal
The all-in-one platform for institutional crypto.
The New Tie Terminal™ is the leading information platform for institutions in digital assets. With its unmatched breadth and depth of proprietary data, our platform powers a consolidated workflow, giving professionals all the information they need to stay on top of the crypto market, and make more informed decisions.
See The New Tie TerminalExplore More on The Tie Terminal
Alerting
From single metric to complex, multi-factor alerts, get notified of critical market moves in real time.
LEARN MORECoin Profiles
Dive into complete coverage of an asset, and access all relevant datasets on a single screen. Instead of going to dozens of disparate platforms to track a coin, our Coin Profiles enable users to stay on top of asset descriptions, news, market data, sentiment, on-chain, data, protocol financials, and much more.
LEARN MOREDashboard
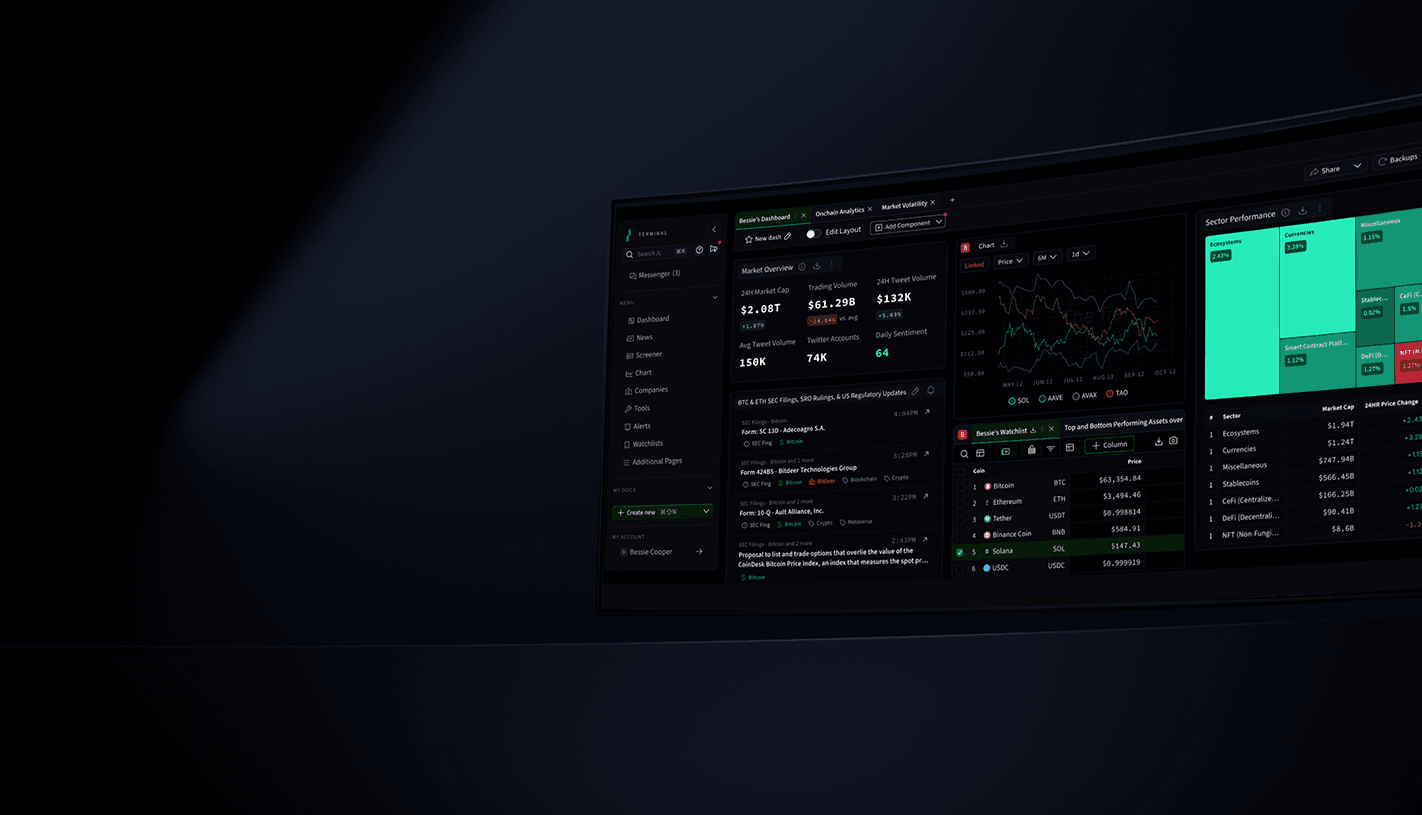
Get the entire crypto market in one screen. Customize your workspace with 100+ pre-built components, and seamlessly integrate third-party data via API or Python script.
LEARN MOREFinance Trends
The Tie Terminal’s Finance Trends are proprietary, crypto-native fundamental valuation metrics built with on-chain data. Understand a token’s value-accrual mechanisms, cash flows, fee structures, and governance rights to make more informed decisions.
LEARN MOREMessaging
Communicate with The Tie’s network of 500+ institutional market participants in a secure and compliant environment.
LEARN MORENews
The Tie’s best-in-class News functionality delivers users with complete coverage of the crypto market, with 4,000+ primary and secondary sources. Create custom News Feeds leveraging our robust tagging models.
LEARN MOREResearch
Access crypto market color and commentary from The Tie and 20+ leading hedge funds, OTC desks, tokens, and service providers.
LEARN MOREScreener
Create your own market overview with hundreds of unique metrics. Leverage advanced filtration to identify opportunities that meet specific criteria, and share useful layouts with your team.
LEARN MOREMobile App
The Terminal’s Key Features power The Tie Terminal Mobile App, enabling you to stay on top of the market and communicate on-the-go.
LEARN MOREUsage Trends
Deep insights into user growth, retention rate, churn, competition, and customer concentration, built using on-chain data. These proprietary insights enable diligence not possible elsewhere.
LEARN MORE